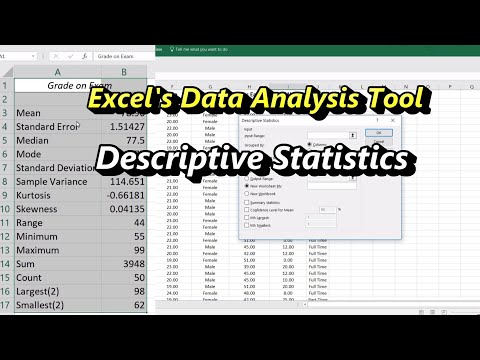
Worksheet: Descriptive Statistics in Excel Using the Data Analysis Tool
Comprehension worksheet generated from the video "Descriptive Statistics in Excel Using the Data Analysis Tool".
Worksheet: Descriptive Statistics in Excel Using the Data Analysis Tool
JaxDoc

Descriptive Statistics Using Excel's Data Analysis ToolLearn Somethinghttps://www.youtube.com/watch?v=pfYhwy3wN14
Vocabulary
- Data Analysis ToolPak — An Excel add-in that provides data analysis tools for statistical and engineering analysis.
- Descriptive Statistics — Statistical methods used to summarize and describe the main features of a collection of data.
- Input Range — The range of cells in Excel that contains the data to be analyzed.
- Kth Largest/Smallest — The largest or smallest value in a data set. For , it represents the maximum or minimum value.
- Summary Statistics — A collection of descriptive statistics that summarize the main characteristics of a data set, such as mean, median, mode, standard deviation, etc.
Questions
Watch the video and answer the following questions based on the information presented.
1.
According to the video (0:43), what are the steps to install the Data Analysis ToolPak if it is not already visible on the Excel ribbon?
2.
When setting the ‘Input Range’ for descriptive statistics (2:44), what keyboard shortcut did the narrator use to quickly select all data in Column C, starting from the header?
3.
In the ‘Descriptive Statistics’ dialog box (3:05), the narrator changed the default value of ‘Kth Largest’ and ‘Kth Smallest’ from 1 to 2. Explain why this change was made.
4.
What does the ‘Count’ statistic represent in the descriptive statistics output generated by Excel’s Data Analysis Tool (4:51)?
5.
The video highlights that using Excel’s Data Analysis Tool is much faster than manual calculations or using individual formulas for descriptive statistics. Discuss how this efficiency could benefit a researcher or analyst working with a large dataset. Provide an example of a specific type of data and analysis where this tool would be particularly advantageous.
Want materials like this for your lessons?
Jax builds worksheets, study guides, and lesson materials for whatever you're teaching. Free to start, no card needed.
![Descriptive Statistics [Simply explained]](https://i.ytimg.com/vi/FzujIYo9GYo/hqdefault.jpg)