Worksheet: Scatter Plots, Association and Correlation
Comprehension worksheet generated from the video "Scatter Plots, Association and Correlation".
Worksheet: Scatter Plots, Association and Correlation
JaxDoc
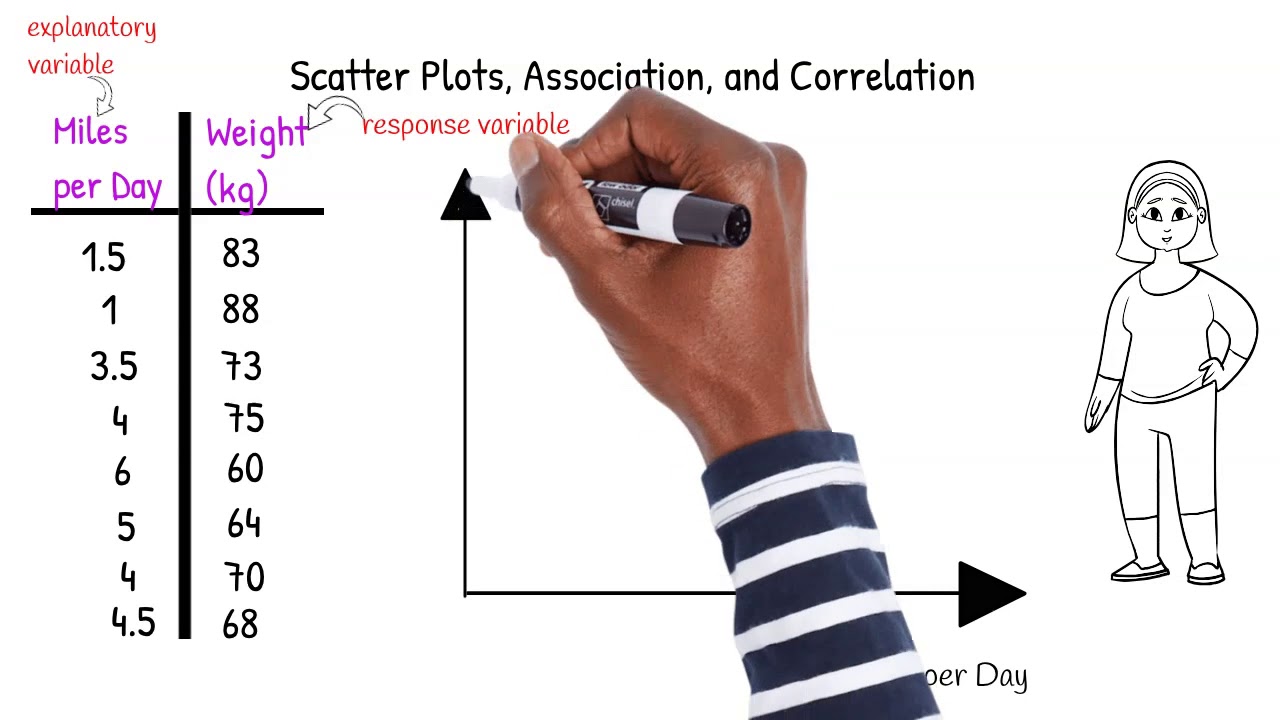
Scatter Plots, Association, and CorrelationNicole Hamiltonhttps://www.youtube.com/watch?v=AxY7nTkgR6M
Vocabulary
- Scatter Plot — A graphical tool used to visualize if there is an association or relationship between two sets of quantitative data.
- Explanatory Variable — The variable that could possibly explain why the other variable responds in a certain way; it is placed on the x-axis of a scatter plot.
- Response Variable — The variable that responds to changes in the explanatory variable; it is placed on the y-axis of a scatter plot.
- Correlation — An association or relationship between two variables, indicating how they tend to change together.
- Causation — A relationship where one variable directly causes a change in another variable, which is not necessarily implied by correlation.
Questions
Watch the video carefully and answer the following questions based on the information presented.
1.
In the video’s example of surveying women, identify which variable was designated as the explanatory variable and which was the response variable. Justify your answer based on the video’s explanation.
2.
Based on the scatter plot created in the video for “Miles per Day” vs. “Weight (kg)”, what type of linear correlation was observed? Describe the general trend.
3.
The video emphasizes that “Correlation Causation”. Explain this concept using the example of “Number of dogs seen on the street” versus a person’s weight, as discussed in the video.
4.
According to the video, what characteristic defines a “strong” linear correlation?
5.
Consider a real-world scenario where two variables might show a strong positive correlation, but there is no direct causation between them. Describe this scenario and explain why correlation does not imply causation in your example.
Want materials like this for your lessons?
Jax builds worksheets, study guides, and lesson materials for whatever you're teaching. Free to start, no card needed.

![Descriptive Statistics [Simply explained]](https://i.ytimg.com/vi/FzujIYo9GYo/hqdefault.jpg)